Topics
- Article
- App & Features
- Sleep
App Update: New Sleep Details Page
The redesigned sleep details page provides you with additional insights, more in-depth metrics, and a greater knowledge of your overall sleep performance.
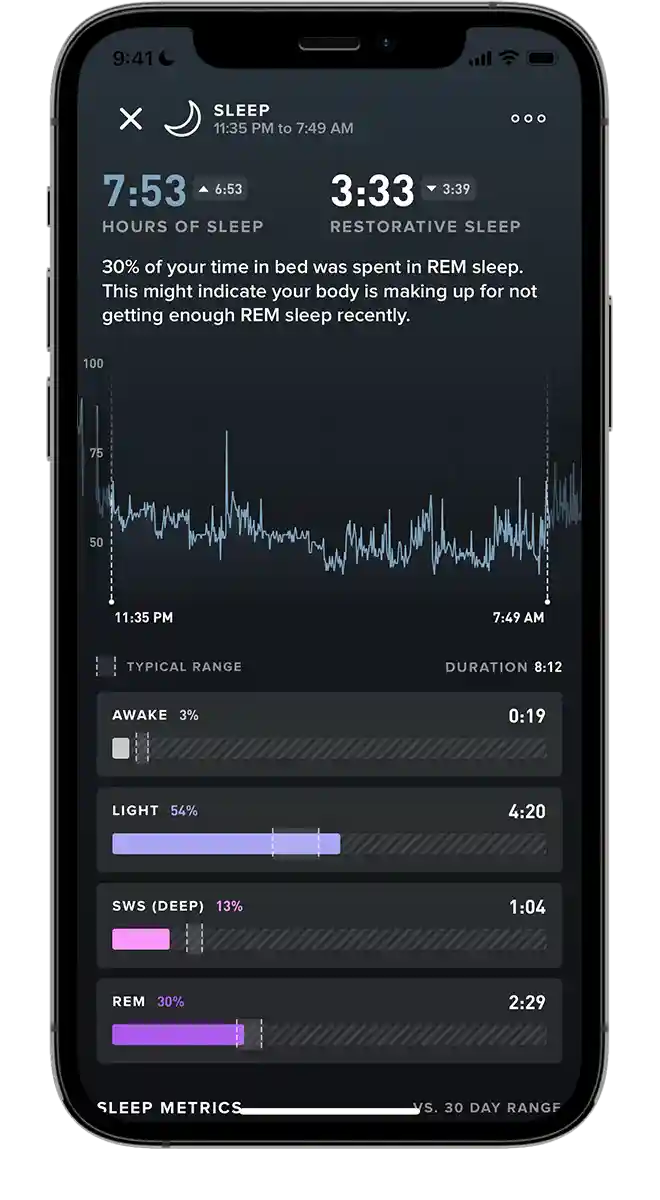
We’ve updated the sleep section of the WHOOP app to help give our members a better understanding of their sleep breakdown and how their recent sleep stacks up against trends over time. When you tap on your hours of sleep, either from the main overview page or the sleep page, you get an upgraded analysis of all the key details of last night’s sleep (if you don't see this yet you will in the next few weeks).
What’s New
To start, we added a very popular request from our members: Your sleeping heart rate graphic now displays the time of day you are asleep, as opposed to the duration of time you spend sleeping. Additionally, you can see the percentage of time spent in each stage of sleep, along with your typical range for each (based on the past 30 days). Plus the trends over time in your restorative sleep for a closer look at how much you’re getting and when.
Tapping on any of the sleep stages gives you the full breakdown of that stage, as well as further analysis and a comparison to your recent average.
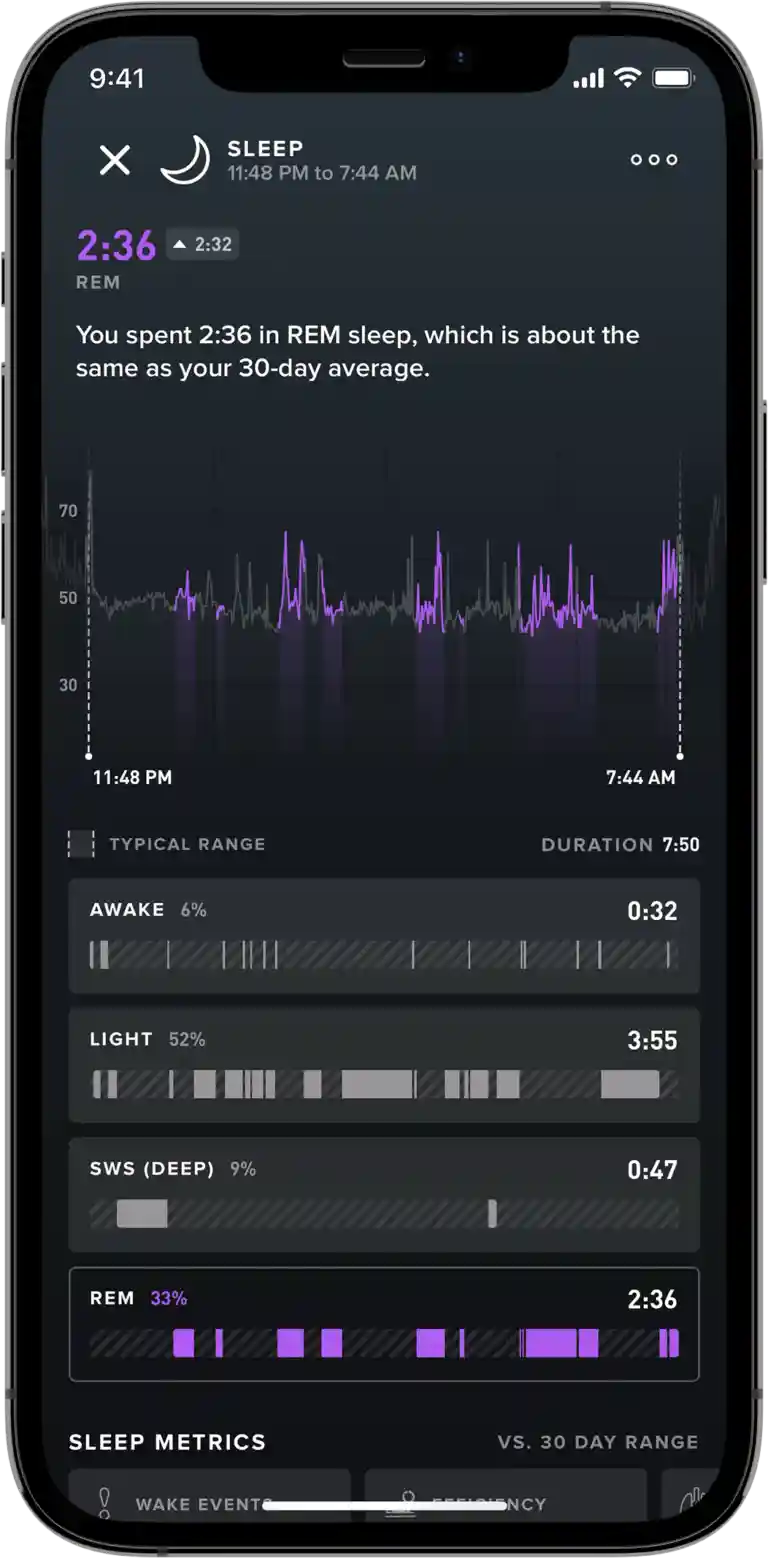
At the bottom of the page you’ll find your sleep metrics, in the same format as what’s featured in the health monitor with your baseline range for each. Included are wake events (formerly disturbances) per hour, sleep efficiency, respiratory rate, and sleep latency (the time it takes you to fall asleep–this only appears if you manually set the time you go to bed).