Topics
- Article
Real-Life 'Fatigue Meter' from Video Game Hockey?
During my junior and senior years of high school, there was one thing my buddies and I did almost exclusively whenever we got together: We played NHL ‘94 for Super Nintendo (not to knock the equally great Sega Genesis version, that’s just what we had). I’m sure there are plenty of guys my age out there who will tell you to this day that NHL ‘94 is the best video game of all time. I wouldn’t argue.
The game was so popular that clips of it made now famous appearances in Kevin Smith’s 1995 film Mallrats (“Breakfast? Breakfast, schmrekfest. Look at the score. I’m only in the middle of the second, and I’m winning 12 to 2. Breakfasts come and go, Rene. Now, Hartford—the whale—hey, they only beat Vancouver once… maybe twice in a lifetime”), and in the 1996 cult classic Swingers.
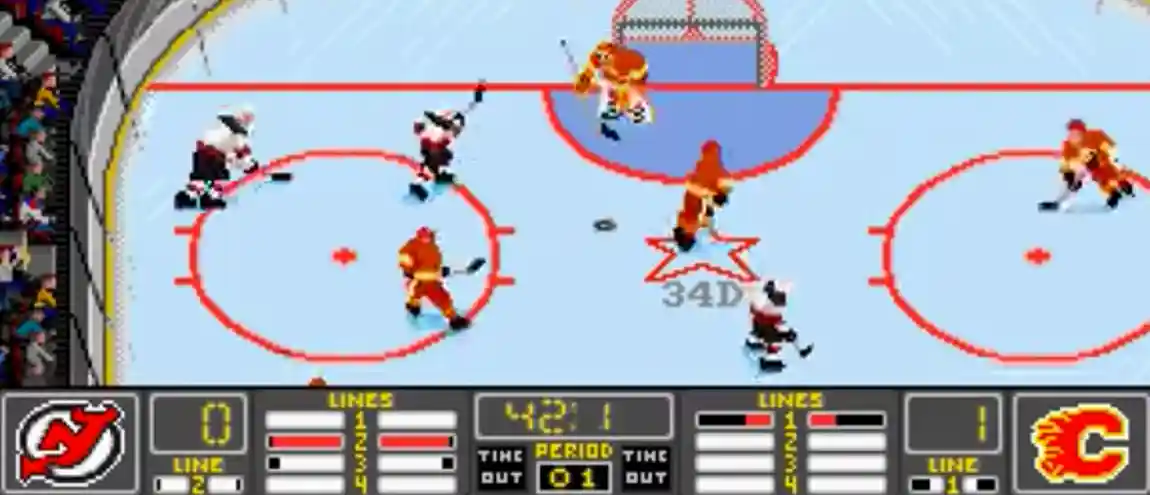
If you chose to play the more sophisticated version of the game with the automatic line changes turned off, it featured “fatigue meters” that indicated how tired your players were (see the photo above and page 30 of the instruction manual). Fatigued lines recovered when given time to rest on the bench.
With today’s technology, it’s possible to manage real-life hockey line changes in the same way that the video game did 20 years ago. One way to do it might be to apply a metric for assessing cardiovascular fitness known as heart rate recovery (HRR). Simply put, HRR represents the decrease in heart rate as it attempts to get back to baseline after strenuous activity.
The dataset below is helpful for understanding HRR. An athlete was instructed to do as many Burpees (a type of squat thrust) as he could in one minute. He was then given a minute to rest and asked to perform the task again. This continued for as long as he was able to keep going:
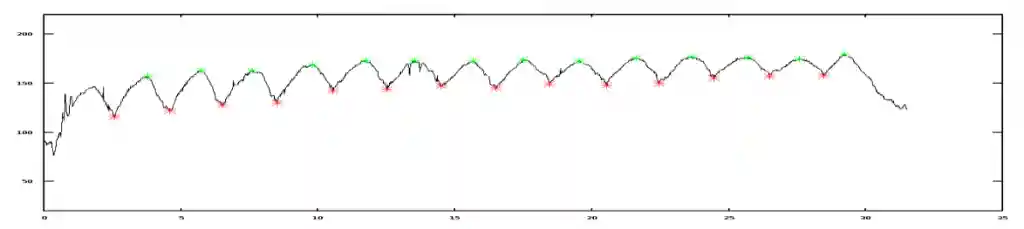
The green points indicate his peak heart rate during each round of exercise, while the red points show his heart rate at the end each resting period–the difference between the two is his HRR. As you can see, his heart rate recovered less and less each time until he stopped. Had it returned closer to normal during his rests, he likely would’ve been capable of performing longer.
A recent case study by WHOOP data scientists Chris Allen and Emily Breslow examined the HRR of WHOOP users after running. Across the board, the runners’ heart rates recovered faster after workouts on days when their WHOOP Recoveries were higher. WHOOP Recovery is designed to show how prepared an athlete’s body is to take on Strain, so it comes as no surprise that there was a direct correlation between it and the runners’ HRR.
The study also indicated that the strength of the relationship between Recovery and HRR varied for each athlete. A key component of WHOOP is the understanding that no two human bodies are alike, and that different people may find success from different training loads and methods.
How can HRR knowledge be practically applied to ice hockey? The typical diagram of a hockey player’s in-game heart rate might appear similar to the athlete’s from the Burpee exercise above. However, the goal would be to ensure that only sufficiently rested skaters are put back on the ice.
Here’s a sample screenshot of one WHOOP user’s data while playing ice hockey:
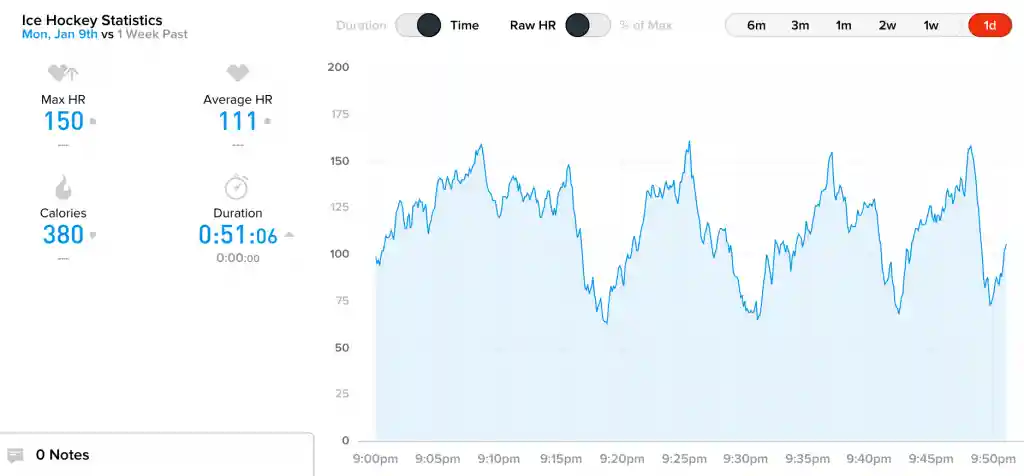
If a coach referenced this data throughout the game, he could substitute lines based on the most recovered heart rates. Not only that, he’d also be able to avoid the scenario mentioned on page 31 of the NHL ‘94 instruction manual:
“Your fatigue bar may be decreased due to one player who’s ‘dogging it.’ Go to the ‘edit line’ screen to get rid of the player who is out of shape.”
Eventually, a coach would acquire enough data to construct lines of players with similar HRR patterns, helping them to each perform and bounce back on the same timetable.