Topics
- Article
- CrossFit
- Member Stories
30 Murphs in 30 Days: What I Saw in My WHOOP Data

Below is an explanation of my thought process before, during, and after I did 30 Murphs in 30 days. I also describe how I couldn’t have done it without WHOOP, with some in-depth analysis of my data.
When the COVID-19 pandemic hit back in March, I decided to channel all the craziness going on in the world and challenge myself to do something I probably shouldn’t have: Completing the workout ‘Murph’ every day for 30 days. Why? I wanted to see if I could do it. It’s a pretty brutal workout to even just perform once (usually taking 45 minutes to an hour to complete), and sometimes it takes the body several days to recover. But I felt it would be a good physical and mental challenge, so I just went for it. Below is an explanation of my thought process before, during, and afterwards. I also describe how I couldn’t have done it without WHOOP, with some in-depth analysis of my data.
What is ‘Murph’?
I first did ‘Murph’ in May of 2015 (as it generally programmed at CrossFit gyms nationwide on Memorial Day Weekend), and have done it every year since then. The workout is in memory of Lt. Michael Murphy, a United States Navy SEAL who was killed in Afghanistan in 2005. It was his favorite workout, and consists of the following:
- a 1-mile run
- 100 pullups
- 200 push-ups
- 300 air squats
- another 1-mile run
All while wearing a 20-pound vest or body armor. It can be done unpartitioned (straight through, as written above) or you can break up the 100-200-300 part (for example, 20 rounds of 5 pullups, 10 push-ups, 15 air squats). I had previously done a few “30-day run challenges” (running a set mile amount every day for 30 days) during internal medicine residency, but I wanted to push the envelope a bit more. I settled on Murph, as it checked the running box (2-miles, with a vest) but more importantly, it was a legitimate challenge that I didn’t know if I could do. And I loved that. So, I decided to give it a shot. What’s the worst that could happen... I fail?
Doing 30 Murphs in 30 Days
At first, I didn’t broadcast it too much. I wanted to see how my body would hold up (especially my hands doing 100 weighted pull-ups every day). I’ve had some bad experiences with ripping up my hands in the past, and if you’ve done that before you know that doing additional pull-ups with ripped hands is no fun at all. After about 5 days and no ripped hands (grips helped), I felt a lot more confident about finishing the task. In fact, the pull-ups and push-ups actually got a lot easier as I progressed. It was the air squats – all 300 of them – that were the worst (very monotonous).

In order to prevent boredom (at least as much as you can while repeating the same workout for 30 days straight) I often mixed up the scheme. I tried it with strict pull-ups (way harder than kipping), and even used the air runner instead of outdoor running (which was also much worse, by the way, and felt uphill at times). Around Day 2 or 3 I started to become curious as to what measurable variables might affect my times--and that is where WHOOP came in.
The Need for WHOOP
I’ve been a WHOOP member since 2017, and am quite familiar with the physiologic metrics it provides (I’m even using it for scientific research to help prevent burnout in medical residents). Early on, it was quite clear that the way I constructed the workout was a big determinant of my final times. The more rounds I broke it up into, the faster I finished. Which, of course, makes sense--the less cumulative muscle fatigue, the harder you can push, the faster you go. But, I wanted to take my analysis further. I decided to see if I could essentially develop a model using some of my WHOOP recovery metrics (heart rate variability, resting heart rate (RHR), sleep duration) to predict my Murph times. Some of the other predetermined covariates that I wanted to try to account for included various ways of partitioning (number of rounds), max heart rate, average HR and time spent in each heart rate zone, and the refractory time between each workout. Let me pause for a quick note on heart rate variability (HRV). It is the variation in time between beats of your heart and represents the balance between your sympathetic and parasympathetic nervous system (fight or flight vs. rest and digest). HRV signifies how capable the body is to adapt, or in this case, take on stress or strain. This plays a big role in quantifying the recovery in an athlete, and so I hypothesized that it might have a correlation with Murph times.
Analyzing the Data
Statistically speaking, the best I could show would be correlation, not causation (by Pearson R--higher correlation is a value closest to 1.0). Let’s look at the graphs… First, we have the basics. My Murph times are in blue and red dashes represent a moving 3-day average. To help visualize a direct correlation with Murph times, rounds are graphed as 25 (the most rounds I ever broke it up into) divided by the number of rounds I did each day (labeled as 25/rounds, more on this to come).
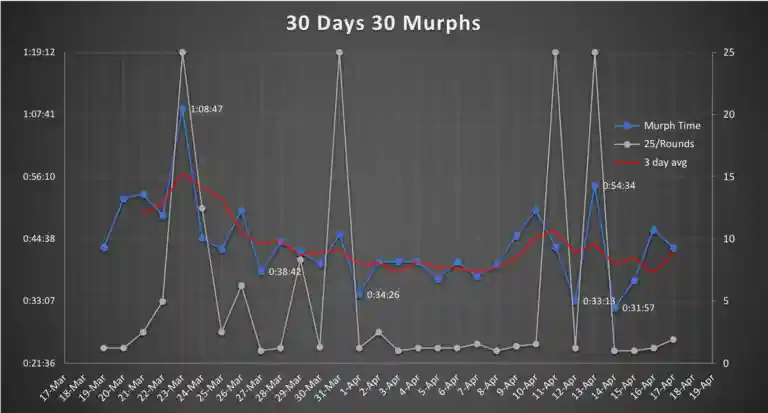
You can see that my overall average times went down as merely repeating the workout, over and over again, improved my fitness. On Day 1, it took me 43:08 (20 rounds of 5–10–15) to complete. Later, on Day 25, it took just 33:13 doing it the same way (20 rounds), and my best was on Day 27 (31:57, 25 rounds). Interestingly, on Day 30, the time was similar to Day 1 (43:08 vs 43:01), but I did it with strict pull-ups on that last day (again, the difference between strict and kipping pull-ups is quite substantial). The relationship between Murph time and rounds showed a moderate-high inverse correlation, so the more rounds the workout was broken down into the better/faster the finishing time (correlation coefficient, R = -0.59). When adding HRV/RHR/sleep duration into the equation, individually, they were not strongly correlated. Nor was there a strong relationship using multiple regression (r² = 0.09, r² indicates the proportion of variation in the dependent variable that can be attributed to the independent variable), which accounts for multiple x variables and their effect on y (Murph time).
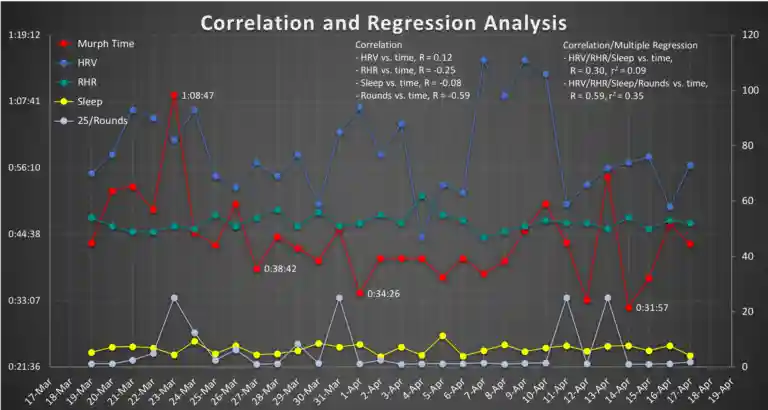
Adding in rounds to the multiple regression bumped up the r² to 0.35, still not very strong, but stronger. I was surprised that the HRV and sleep did not correlate as well, but there are multiple confounders that are unaccounted for (the big one being ‘effort’) and it was an imperfect data set (my own fault) as I did the workout strict and used the air runner several times instead of running outside.
Quantifying Effort with Heart Rate Zones
Given that ‘effort’ seemed to be a factor to be unaccounted for, I wondered if maybe there was a way to quantify it. I looked at the average HR and max HR, and how they related to each time. Maybe the harder I pushed (effort) would be captured by one or both of these values? There was a decent correlation (inverse) between average HR and time (R = -0.50).
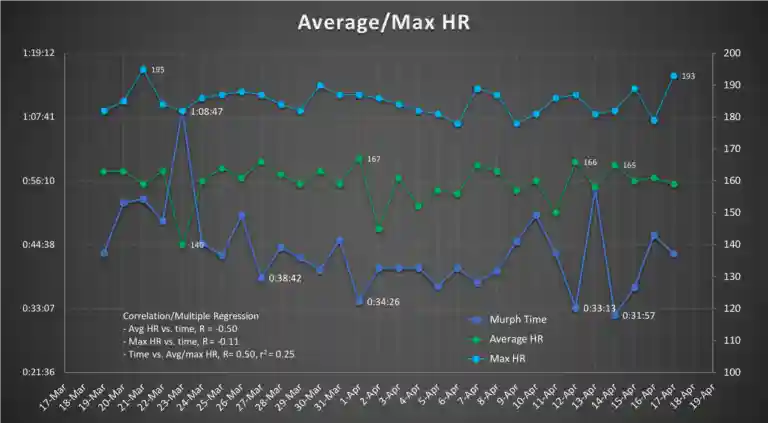
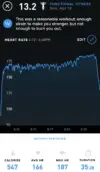
The addition of max HR with average HR showed a mild-moderate fit based on multivariate regression (time vs max HR/average HR), r² 0.25. Average HRs were generally in the 150s-160s (high of 167) and max HRs were in the 180s most days, with local maxima of 195 and 193. Most of the workouts showed an upward trend of HR throughout the workout, which was nearly maxed out on the final mile. Below is a screenshot of my HR data from one workout (Note the spikes in the middle, corresponding to each individual round).
Using HR Zones as a Guide to Optimize Murph Time
Next, I was interested in objectively quantifying a physiologic adaptation to repeating the same workout for 30 days. To do this, I used the time spent in each HR zone (<50%, 50-60%, 60-70%, 70-80%, 80-90%, and 90-100%). A first pass through the data showed that time spent in the 60-70% and 80-90% zones were the strongest independent predictors of workout time (R = 0.6 and R = 0.47, respectively).
My interpretation here is that it was beneficial to my Murph times to stay in a submaximal HR zone as long as possible (80-90%), and minimize time spent in the lower HR zone (60-70%), while not ‘burning out’ or pushing too hard and elevating into the highest HR zone (90-100%).
Optimizing HR zone time was a key determinant of improving my Murph times. This is quite valuable insight and I will strive to stay in this optimal HR zone for workouts like this in my training moving forward.
Tracking Fitness Gains Over the 30 Days
In order to key in on a physiologic response (an improvement in fitness), I decided to look at the percentage of time in each HR zone in Day 1-15 vs Day 16-30, and then compare these numbers to the Murph times. As you can see, my average Murph time improved in the second half, from 45:57 to 41:24. Additionally, the time in the 80-90% of max HR went down from 55.1% to 47.6%, while time in the 70-80% range went up from 34.8% to 45.6%.
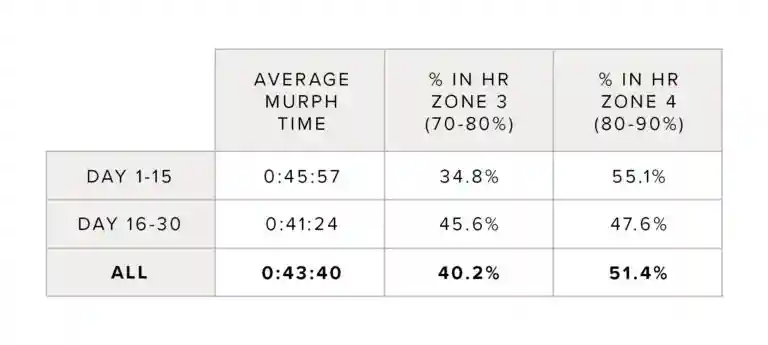
What this means is that for a fixed output (the “work,” Murph, was a constant), the myocardial oxygen demand was less in the second half of the month, corresponding to less of a compensatory HR response (less time at higher HR even though I was working harder and finishing the workouts faster). This was really cool to see--a quantifiable improvement in fitness. It also may help give a good target HR to optimize Murph times (and possibly other workouts) in the future.
Final Stats for the 30 Days
Here are the overall stats from my 30 days and 30 Murphs:
- 3000 pull-ups
- 6000 push-ups
- 9000 air squats
- 60 miles ran
- Total time: 21 hours and 50 minutes
- Average time: 43:40
- Fastest time: 31:57 (20 rounds, every 45 seconds)
- Slowest time: 68:47 (in work boots and jean shorts, a really bad idea)
- Subjectively worst workout: Strict unpartitioned on air runner (54:34)
- Favorite way to partition: 25 rounds of 4–8–12 (not as bad on the legs as 5–10–15)
Improvements in WHOOP Metrics
Check out the improvements in my HRV, RHR, and average time asleep from my previous 30-day average compared to after completing the 30 Murphs in 30 days:
- HRV increased from 71 to 78
- RHR dropped from 57 to 52
- Sleep duration went from 5:21 to 6:33
This is also a good indicator of fitness gains from the start to finish of the 30 days. It’s likely a cumulative effect from all the cardiovascular exercise (running with a vest is a killer workout) and dialing in the nutrition to fuel my body for this endeavor. What is even more interesting is comparing these numbers to my baseline over 21 months of residency. My HRV 30-day average is now 78, compared to a previous baseline of 62 +/- 9 (1.67 standard deviations better), and my RHR is 52 compared to a baseline of 57 +/- 2.5 (a full 2 standard deviations better). The 30 consecutive days of repeating a pretty strenuous workout were clearly enough to cause a measurable improvement in markers of fitness and performance.
HRV, Recovery & Sleep Analysis
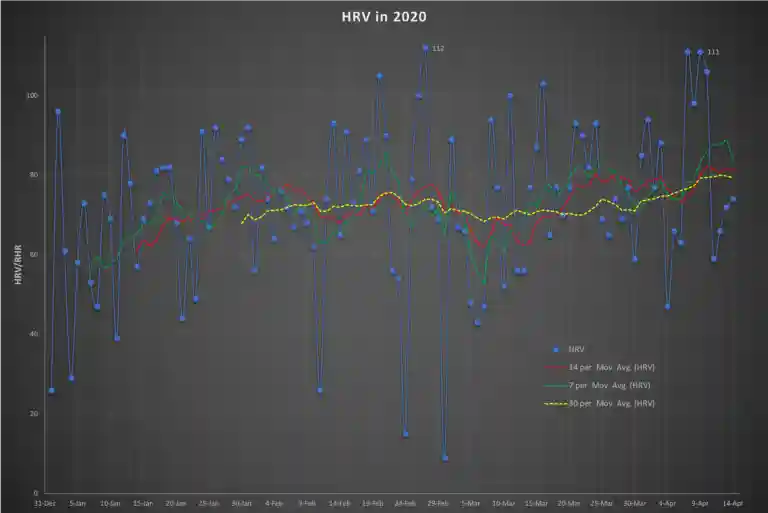
A closer examination of my 2020 WHOOP data shows some peaks and troughs, but overall improvements in virtually all metrics. Take a look at my HRV, shown in 7, 14 and 30-day averages:
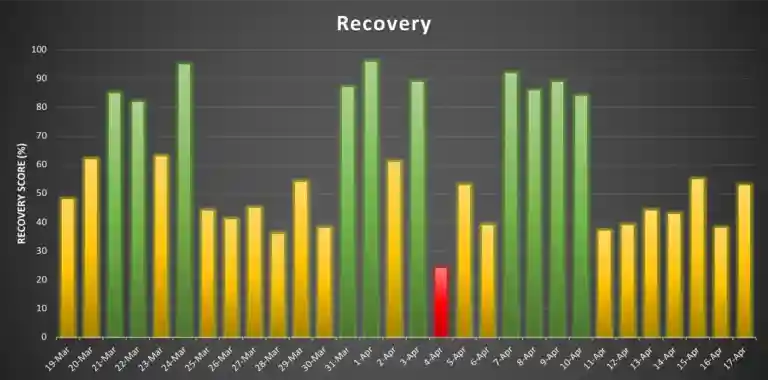
When viewing my daily WHOOP recovery for the month (see below), you can see a nice spike in green about the halfway point. That was for the Wodapalooza competition in Miami, peaking at the right time! But this next part is what’s really wild to me: Only 1 (ONE!) red recovery (33% or lower) over the entire 30 days.
My best theory on this is that HRV is the main driver of recovery, and my HRV was rising due to improved fitness, so as a result my recoveries were generally strong. Also, I was sleeping more than usual because I knew that I was putting a beating on my body, so I was accumulating more restorative time (REM and deep sleep). The 6:33 of sleep per night is my highest 30-day total since starting residency. Looking back at my data, my average sleep per night throughout residency (June 2018 to present) has been 5:40 (with std dev of 32 minutes). Thus, my average sleep for the month was 1.65 standard deviations above baseline. Wow. That’s a lot. Knowing that I was putting my body through the ringer, I prioritized sleep and recovery in order to maintain high levels of performance. At the same time that I was doing Murph, we were unveiling our study on residency wellness/burnout (linked above) and I vividly remember a phone discussion with Dr. Jamie Coleman immediately following a workout one day. Her response was “You’re crazy.” This was also during peak COVID, and I was actually working in the Emergency Department at the time, which was quite the experience. I would do the workout before work (5-6 am) or immediately after work (which sometimes was as late as 9-10 pm as the hospital can be quite unpredictable). Interestingly, more rest time between workouts did not correlate with faster times.
More Sleep and Recovery Stats
Some additional numbers worth pointing out:
- Average recovery: 60%
- Worst recovery: 24% (Day 17)
- Best recovery: 96% (Day 14, all metrics were well above baseline, including an HRV of 94!)
- Most sleep: 11:25 (Day 18, definitely related to the marathon row on Day 17, keep reading...)
- Least sleep: 3:46 (Day 15, coached CrossFit before work that day)
WHOOP strain and other notable things…
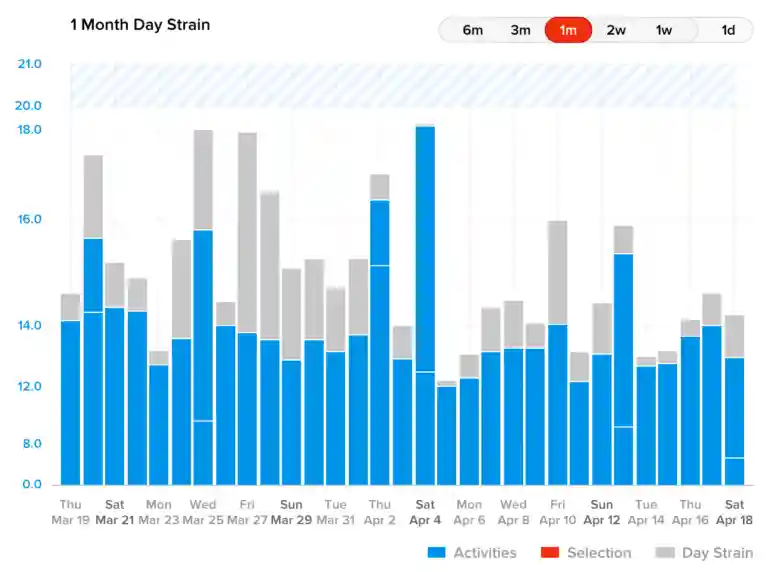
Again, not the smartest idea but on Day 17 a buddy of mine and I did a marathon row. I hit Murph in the AM, recovered for a bit, and then at 1 pm we rowed 42,195 meters (26.2 miles). It took us 3 hours and 35 minutes. It’s safe to say my WHOOP strain (a measure of cardiovascular exertion) was particularly high that day, 18.3 on a scale of 0-21. Notice the strain from workouts (in blue in the chart below) on April 4, which is that’s why I slept 11+ hours that night.
What did I do when I finished? I wanted to take that vest off. Obviously after each workout, but also after the 30 days. I wanted to see how it felt to do a Murph unvested. So on Day 31, I did it one more time. Without a vest, in 26:47. The runs were 6:15-ish and 6:40-ish and I tried to hold 20 rounds of 5–10–15 every 40–45 seconds (I couldn’t keep 40 all the way though, which was only about 10 seconds of rest after each round). Oh also, earlier that morning on Day 31, I took up NFL fullback Dan Vitale on a pushup challenge: 10 push-ups every 30 seconds for an hour (1200 push-ups in 60 min), but that’s another story... No surprise, it hurt really bad, the entire time.

Final Takeaways
Circling back to the data, the more rounds you use to break up the work, the more your muscles recover and the less they fatigue, so the faster you go. And the harder you work, the higher your HR is during a workout, the faster/better your time is. I do believe (not to sound cliché) that this is the future. Using objective data is always preferred over subjective data, and I think we have a lot more to learn about how to best use and implement these metrics to improve our daily lives. So what can you do with all this information?
- If you plan on doing Murph next Memorial Day, or any day in between, the data is pretty compelling to support doing it in 20 rounds of 5–10–15, or (my favorite) 25 rounds of 4–8–12. I recommend trying to keep an EMOM (every minute on the minute) pace.
- Continuous aerobic capacity work makes you fitter--not really a groundbreaking conclusion, but this is objective data that shows the physiologic adaptation.
- Also, regarding HRV in particular, even though it wasn’t a strong predictor here it is important to realize that even my worst HRVs during the 30 Murphs were still above my baseline (all but 3 days, actually). I think this clouded the analysis.
- If you want a fast time, don’t do it in boots and jorts.
In summary, I did 30 Murphs in 30 days. I learned a lot--about myself, mental fortitude, physiologic adaptations, and I even brushed up on some statistics along the way. It was a ton of fun. On my final run each day I would often think about how I wanted to write this all up. So here it is. I hope you learned something too.