Topics
- Article
- Heart Rate
Heart Rate Accuracy: How WHOOP Improves Wrist Readings
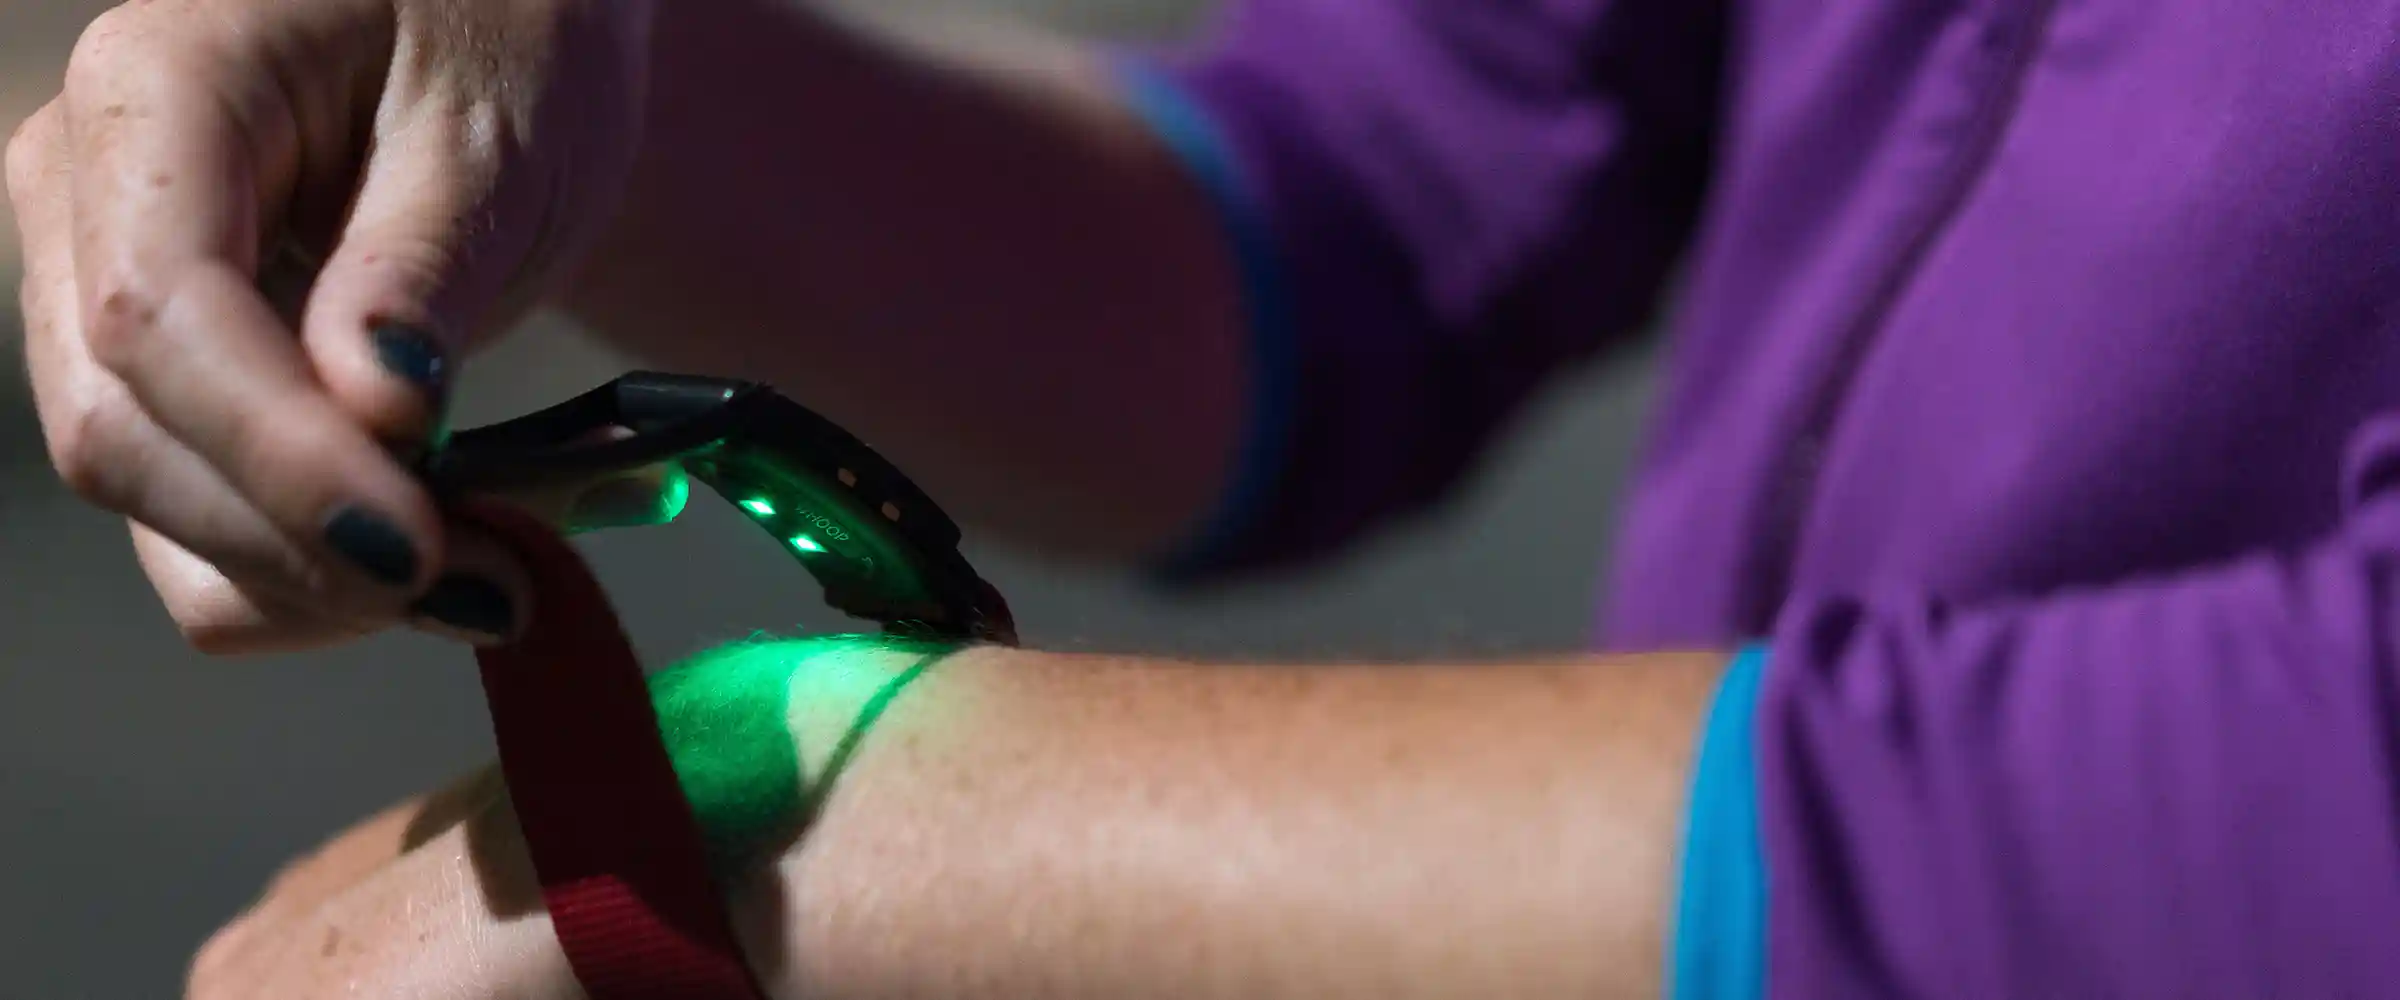
Here at WHOOP, we are constantly working towards bettering our ability to optimize athlete performance. Part of that is a commitment to deliver the best heart rate accuracy under any condition—whether it be sleeping, walking, running, swimming, cycling, lifting weights, playing NFL football, or any of the other numerous activities that make up the daily lives of our members. To keep up with this challenge, our patented heart rate calculation algorithm is continuously evolving.
The goal is to diminish the impact of movement and other noise on the heart rate signal. In general, it is much more difficult to calculate heart rate via photoplethysmography (the technology behind the green lights on the bottom of your Strap) when the body is moving than when it is at rest. Our algorithm processes the massive amount of data we collect from our sensors, effectively removing the noise from the signal.
This forms the foundation for the Strain, Sleep, and Recovery analysis that WHOOP provides.
The WHOOP heart-rate algorithm uses advanced techniques from digital signal processing and statistical inference. There is a lot of data to make sense of and many different ways the noise can corrupt the signal. To get around this, we use multiple concurrent estimators, where each optimizes the likelihood of heart rate accuracy for a given context.
We are then able to pick and choose the estimates that maximize the likelihood of accurately determining your heart rate at any given time.
WHOOP is constantly estimating your heart rate in a variety of different ways. This allows for it to be accurate under all conditions, ranging from sleep to high-intensity workouts. The graph presented below, known as a spectrogram, gives an inside look into how our sensors "see" the heart rate data.
The example specifically shows how WHOOP can keep up with interval training through phases of high-intensity and low-intensity activity.
Figure 1, optical signal spectrogram: The normalized amplitude of each frequency (0-200 BPM) vs time. The color scale is from dark green (0) to bright yellow (1). The yellow traces in the plot represent the heart rate candidates at any time. The dash line represents the true heart rate.
How optical heart rate measurement works
Wrist-worn wearables use a technology called photoplethysmography to measure your heart rate. This method relies on optical sensors that shine light into your skin to detect changes in blood volume. As your heart pumps, blood flows through your wrist, absorbing the light.
The sensor measures the light that reflects back, translating those variations into your heart rate.
While this technology is highly effective at rest, movement introduces noise. When you run, lift weights, or play sports, the physical motion of your arm can disrupt the sensor's connection with your skin. This is why capturing an accurate signal during high-intensity activity requires more than just hardware—it requires advanced software to filter out the noise and isolate your true heart rate.
Data-driven machine learning in heart rate calculation
In 2017, WHOOP updated its heart rate calculation algorithm to incorporate data-driven machine learning, a foundation that was further advanced by a comprehensive core algorithmic rework in February 2026. In order to train your WHOOP, we used an enormous dataset consisting of thousands of hours of recording spanning various workouts from diverse subjects. And this is just a start—the more data that is collected with WHOOP, the smarter your WHOOP will become.
By employing a data-driven method, each heart rate estimator is now optimized for the best performance use in certain conditions: Sleep, low-intensity activity, regular activity like running, high-intensity activity like CrossFit, etc. Every second, the WHOOP machine-learning engine evaluates more than 250 parameters (movement, acceleration, skin conductance, ambient light, etc.) to determine your most likely heart rate.
Figure 2: The correlation matrix of the 250 features calculated each second to estimate the most probable heart rate. Each square represents the correlation between two of the 250 features used to assess heart rate. The correlation value is between -1 (dark blue, or completely anti-correlated values) to 1 (dark red, completely correlated values). The trees on left and top of the graph represent the clustering of all 250 features. Each subtree represents features calculated from time domain, frequency domain, accelerometer and physiological values.
The above figure displays the complexity and diversity of the features used at any time for heart rate estimation. This is illustrated by the fact that no two features are completely similar or correlated. Additionally, the fact that all the rows and columns are unique shows the tremendous variety of complex scenarios and conditions in our analysis.
By using the information encoded in all of these features, we can help eliminate the occasional outliers in reported heart rate data.
How to get more accurate wrist heart rate readings
Even with the most advanced algorithms, physical fit plays a critical role in data accuracy. To ensure your device captures the best possible signal, you need to wear it correctly. The sensor must maintain continuous contact with your skin, especially during vigorous movement.
First, position the device about one inch above your wrist bone. This placement avoids the narrowest part of your wrist, where bone movement can easily disrupt the sensor. Second, adjust the band so it is snug but comfortable.
You should not be able to slide a finger underneath the sensor, and it should not move when you shake your arm.
Finally, keep the sensor clean. Sweat, lotion, and sunscreen can build up over time and block the optical light. If you experience data drops during specific workouts, consider using WHOOP Body apparel to move the sensor off your wrist and onto your bicep or torso, which often experience less erratic movement than your hands.
Advanced heart health monitoring and accuracy
Continuous monitoring goes beyond tracking your beats per minute during a workout. Advanced health features require an even higher standard of precision. When you monitor metrics like HRV (Heart Rate Variability) or use features like the Heart Screener with ECG readings, your device is analyzing the microscopic time differences between each heartbeat.
This level of detail allows for Irregular Heart Rhythm Notifications (IHRN) and deeper insights into your cardiovascular health. By maintaining a snug fit and wearing your device consistently, you empower these advanced sensors to build a complete, accurate picture of your baseline. The improvements we have made over time have been substantial, and we are looking forward to continuing to develop our algorithms as we further learn from the data.
Frequently asked questions about heart rate accuracy
How accurate are wrist heart rate monitors?
Modern wrist heart rate monitors are highly accurate, especially at rest. During high-intensity activities, accuracy depends on the device's ability to filter out movement noise. WHOOP combines optical sensors with advanced machine learning algorithms provide professional-grade precision across a wide range of activities.
Can a heart monitor detect AFib?
Yes, certain advanced wearables equipped with ECG technology and Irregular Heart Rhythm Notifications (IHRN) can detect signs of AFib (atrial fibrillation). These features analyze your pulse rate data to identify irregular patterns, though they are designed for informational purposes and should not replace a medical diagnosis.
What factors affect resting heart rate accuracy?
Resting heart rate accuracy is primarily affected by device fit, sensor cleanliness, and skin contact. Wearing the band too loosely allows ambient light to interfere with the optical sensor. Ensuring a snug fit about an inch above the wrist bone guarantees the most reliable resting metrics.