Topics
- Article
- App & Features
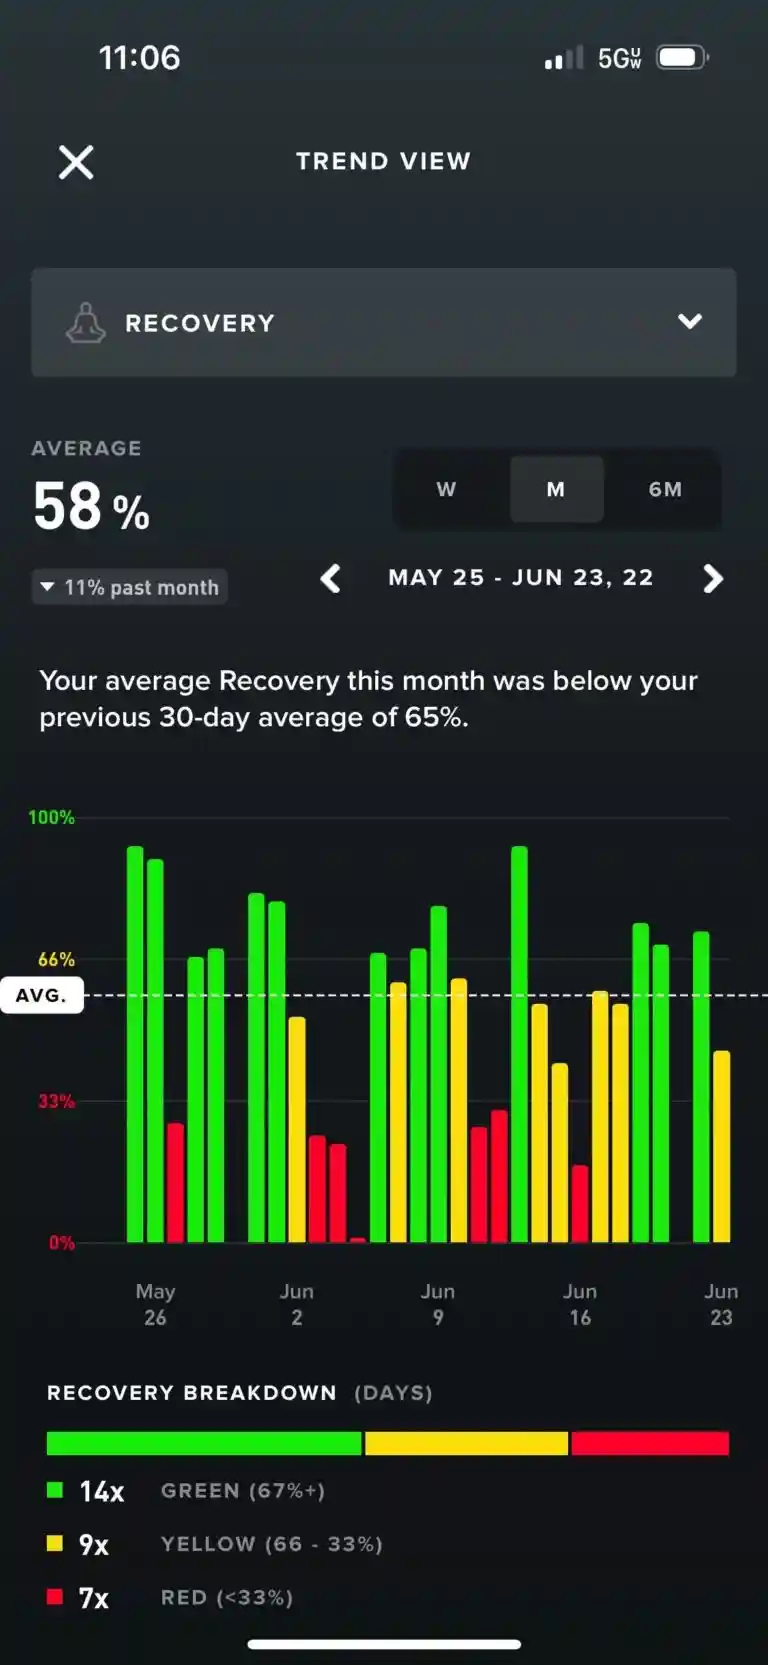
Track Progress with New Trend Views

See your weekly and monthly trends for Sleep, Strain, and Recovery to gauge your progress, hold yourself accountable, or get extra motivation.
One of the biggest benefits of being a WHOOP member is being able to understand your personal biometric data, from the amount of time you spent in REM sleep last night to how your heart rate increased during a workout. Now, we’re giving you more ways to understand your data beyond a daily view with weekly, monthly, and 6-month trend views for Sleep, Strain, and Recovery. These trend views make it easier to evaluate your progress over time and can be especially helpful if you are undertaking longer-term training cycles, or if you want to see how small, daily changes can add up over time.
Trend Views You Can See
View weekly, monthly, and 6-month trends across Sleep, Strain, and Recovery, including in-depth views of:
Sleep
- Sleep Performance
- Hours vs. Need
- Time in Bed
- Sleep Consistency
- Restorative Sleep (%)
- Restorative Sleep (Hours)
- Efficiency
- Sleep Debt
Strain
- Day Strain
- Calories Burned
- Average HR
Recovery
- Recovery Score
- Resting Heart Rate
- Heart Rate Variability
- Respiratory Rate
Other
- Body Composition
- Weight
- Total Day Stress
- Sleep Stress
- Non-Activity Stress
Trends to Look for In Your Own Data
As you get fitter, you’ll likely notice your resting heart rate decreasing. A lower resting heart rate is a sign that your heart muscle can pump a greater amount of blood, and as a result, doesn’t need to beat as frequently. When your heart is strong and doesn’t need to work as hard to push blood throughout the body to deliver oxygen to your muscles, your fitness improves. Increases or decreases in your heart rate variability (HRV) can be signs of overall improvements to your fitness, or that you could be sick, dehydrated, or something else. High heart rate variability means your parasympathetic and sympathetic nervous system is balanced – which means your body is ready and able to take on more strenuous activities. Lower heart rate variability is a sign that your parasympathetic nervous system and sympathetic nervous system are not balanced, which could mean your body is working hard because you’re sick, dehydrated, fatigued, or even overtraining. Changes to your activity Strain can be a sign of improving fitness. Strain is calculated by looking at your cardiovascular and muscular load. The higher your heart rate and the longer it stays elevated means a higher Strain. Additionally, the more muscular load you put on your body, the higher your strain. As your body adapts and your fitness improves, your Strain scores will likely decrease
How Athletes Are Using Trends

Pro cyclist Alex Howes looks at his data trends to better understand his baselines, to optimize his training cycles, and to see how any changes he makes are affecting him both in the short term and the long term. In June 2022, Alex had his lowest Recovery ever – 1% – after the grueling Unbound Gravel race, the biggest gravel cycle event in the U.S., during which he was unknowingly fighting COVID-19. Alex had been traveling extensively before the event and didn’t feel well, but decided to race anyway after taking 7 negative COVID tests. While his daily data indicated something was amiss, when reviewing his 1-month data trends, he could see exactly when COVID hit, and how long it took for his body to fully recover after battling the illness. The combination of Alex’s 1% Recovery, a low personal HRV of 21 (ms) HRV, and a high 20.7 strain knocked Alex out for almost a month before he returned to his baseline – all visible in his trend views, especially in his Recovery, with a noticeable uptick in lower-than-average yellow and red Recoveries post-race and post-illness.
How to Access Trend Views
To see your trends, head to the Sleep, Strain, or Recovery section of the app. Scroll down to view your weekly trends, or tap 'View Monthly Trends' for more information.