Topics
- Article
- Recovery
- Respiratory Rate
WHOOP Recovery Now Factors in Respiratory Rate
Recently, we’ve taken a close look at respiratory rate and worked with research partners in Australia and the US to determine how this metric responds to respiratory illnesses like COVID-19.
WHOOP strives to provide the most accurate analytics by continually updating the metrics and feedback we provide, based on both new research conducted by our internal R&D teams, and by academics around the world. Recently, we’ve taken a close look at respiratory rate and worked with research partners in Australia and the US to determine how this metric responds to respiratory illnesses like COVID-19. Interestingly, we’ve found that respiratory rate also provides relevant information for predicting performance in healthy people. Here we explore the information that respiratory rate holds – both by examining current research and analyzing WHOOP data – and then dive into our update to now include this metric in WHOOP recovery.
What Drives Respiration?
Respiration plays a central role in maintaining homeostasis within the body by delivering oxygen and removing carbon dioxide from the blood. Respiratory rate is a complex metric as it responds to a variety of factors in order to maintain the levels of oxygen and carbon dioxide. For example, an increase in metabolic rate brought on by exercise causes respiratory rate to increase. But what about changes in respiratory rate at rest? WHOOP measures your respiratory rate while you’re sleeping so that acute changes to stimuli like exercise are not a factor. At the beginning of the COVID-19 pandemic, we wrote about the science behind why we think respiratory rate may be a useful metric to track during this particular pandemic because COVID-19 is primarily a lower respiratory tract infection. It’s beyond the scope of this article to dive into that again, but even as COVID-19 has thrust respiratory rate into the spotlight, it’s worth paying attention to what respiratory rate can tell us during “normal” times. Since WHOOP collects data even when you’re healthy, detecting smaller deviations from baseline becomes feasible. We were unable to find existing research on acute changes in respiratory rate in healthy adults, so we’ll rely on the power of aggregating WHOOP data to drive our understanding of the relationship between respiratory rate and performance. Using WHOOP data, we examined the days when members’ respiratory rate increased compared to their baseline – but not necessarily above the generic “normal” range.
Respiratory Rate and WHOOP Data
After over 5 years of collecting respiratory rate from our users we’ve assembled a massive dataset, allowing us to uncover patterns in data that might otherwise go unnoticed. These patterns are sometimes too noisy to see in any individual member, but become apparent when averaging over millions of WHOOP activities. We are particularly interested in understanding whether there exists useful information about performance within members’ nightly respiratory rate, beyond what is already captured by their resting heart rate (RHR) and heart rate variability (HRV).
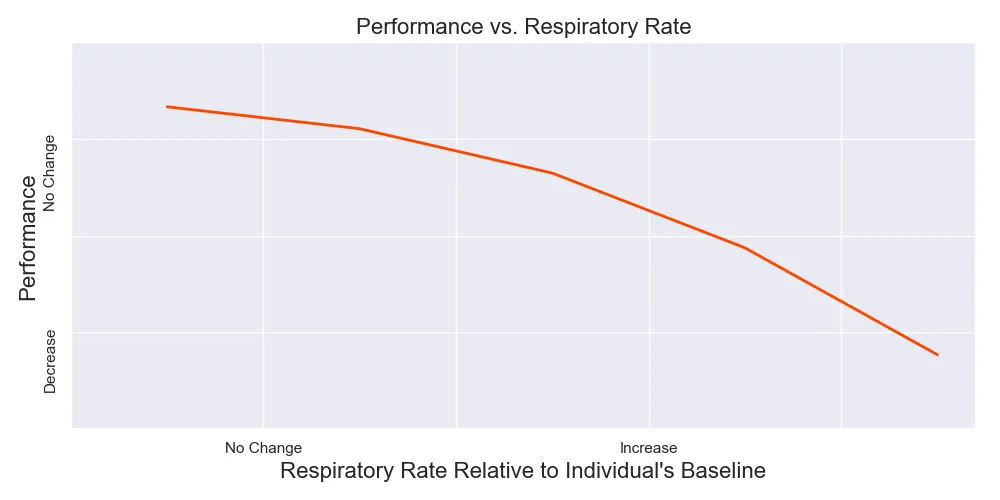
we plot change in perceived athletic performance against change in respiratory rate. Note that this line represents the average of many data points, and it is expected that members sometimes experience no change in performance – or even an increase in performance – despite an increase in respiratory rate.
That said, as respiratory rate increases relative to the member’s baseline, on average, performance decreases. This trend is compatible with existing literature; an increase in respiratory rate tends to indicate that the body is struggling to maintain homeostasis. But how much of the information that respiratory rate provides is already captured in WHOOP recovery? Changes in respiratory rate often mirror changes in resting heart rate, so it’s possible that this information is redundant for our recovery metric. To understand the unique value respiratory rate offers, we need to look at respiratory rate while recovery is held constant.
To understand the unique value respiratory rate offers, we need to look at respiratory rate while recovery is held constant.
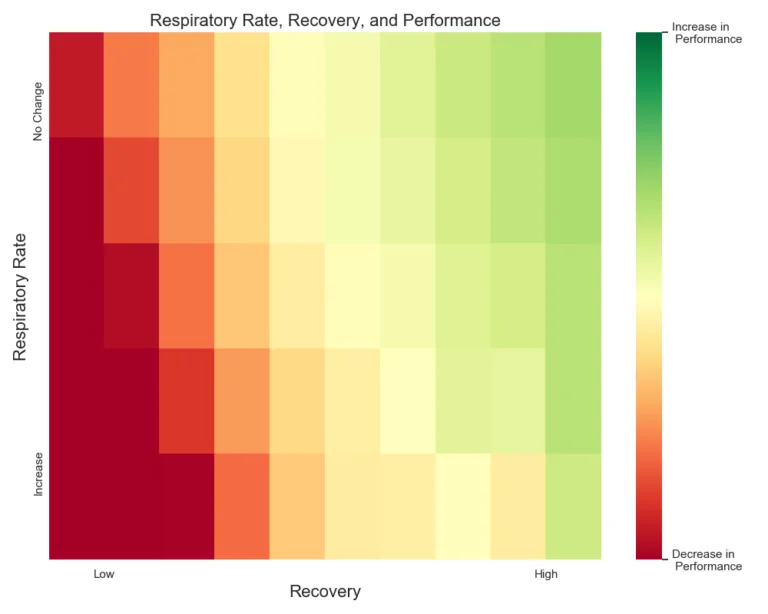
Below, we visualize this relationship in a heat map, in which we represent on a color scale the average performance change of all data that falls into a particular section of the plane: The x-axis divides the plane by recovery; the left side includes data points with lower recovery while the right side includes points with higher recovery. Similarly, the y-axis divides the plane by respiratory rate; the top includes data points where a member experienced a decrease in respiratory rate, and the bottom an increase in respiratory rate. The color of each box in the plane is determined by the average performance of all data points that lie in the box. Therefore, when we look within any column of boxes, we are holding recovery constant, and within any row, we hold respiratory rate constant. Notice that the majority of the changes in color occur as we move from left to right on the plane – i.e. as recovery changes. This makes sense; we would expect that recovery holds more information about performance than respiratory rate. However, there is still gradation in the color as we move from top to bottom in the plane, especially when recovery is low. Therefore, holding recovery constant (i.e. looking within a column), we can see that respiratory rate offers additional information relevant to performance.
Respiratory Rate Incorporated into WHOOP Recovery
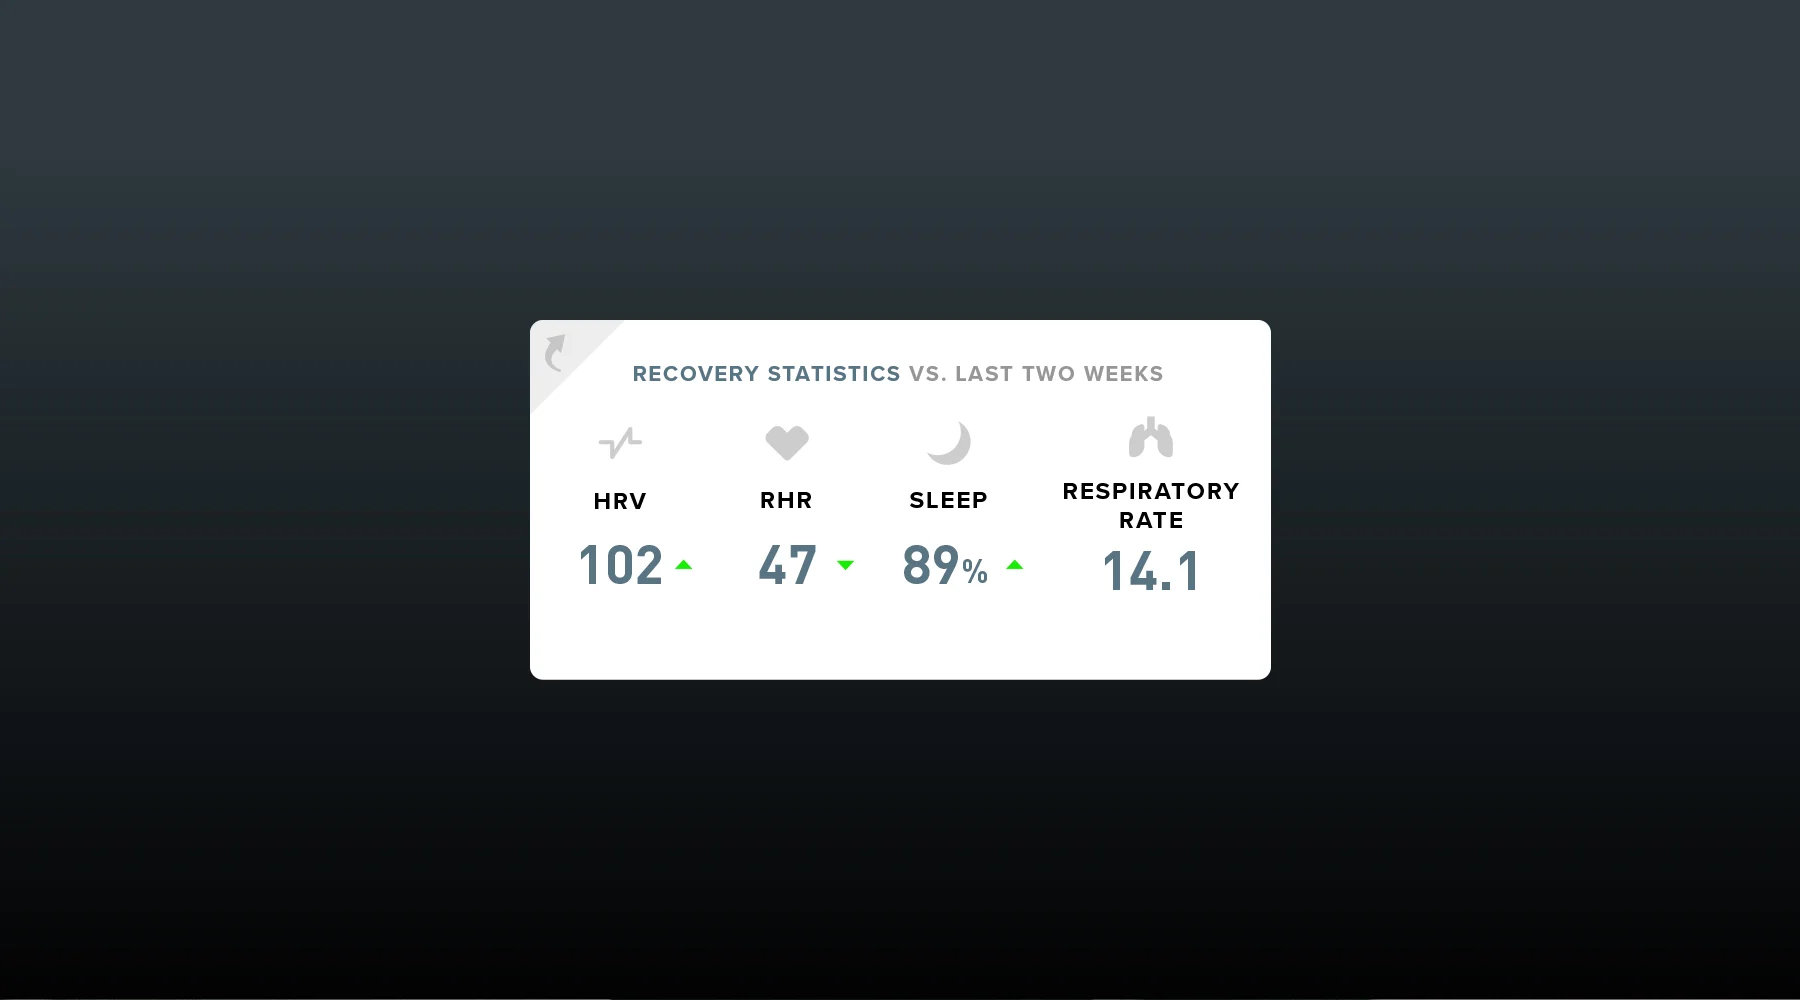
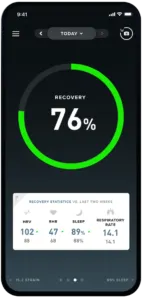
While we’ve calculated respiratory rate for years for the purpose of sleep staging, we exposed it to WHOOP members first in the web app and more recently in the mobile apps to allow members to utilize this information. Incorporating respiratory rate into recovery will further enable members to action this information, particularly when changes are subtle. Previously displayed in the sleep section of the WHOOP app, respiratory rate now appears alongside other recovery statistics:
Since respiratory rate offers the most information when recovery is low and respiratory rate is high, the update will not affect your recovery most days. Rather, only when respiratory rate is elevated, and in particular when recovery is already suppressed, respiratory rate will now be used to adjust your recovery to a more appropriate level. Adding respiratory rate to recovery allows users to more easily leverage the information contained in the metric. Keeping an eye out for unexplained changes in any of your recovery metrics is always a good idea, and by bringing respiratory rate into recovery, we’ve made it simpler for members to interpret the complex signals their body is sending.
WHOOP is not a medical device, our products and services are not intended to diagnose COVID-19, the flu or any other disease, and should not be used as a substitute for professional medical advice, diagnosis or treatment.